

Your company is set up with Microsoft 365 and you feel good that your team has the tools they need to work productively from anywhere. They can collaborate within Teams, access and share files in OneDrive and SharePoint, and use Word and Excel to coauthor and comment on documents.
Your business continuity and productivity are looking good and your business is resilient should another pandemic or other crisis hit.
But… is your team fully optimised in the M365 cloud environment? Or are they missing opportunities simply because they’re not sure what is considered a “best practice?”
It turns out that Microsoft has already thought about this and has created a tool called Productivity Score to help remove blind spots that companies may have regarding their team’s use of Microsoft 365.
If you haven’t yet discovered this tool in the Microsoft 365 Admin Center, you may want to take a look for it. You’ll find it under Reports > Productivity Score.
We’ll go through what this tool does and how you can use it to fully optimise your team’s use of Microsoft 365 apps.
Microsoft Productivity Score Overview
Microsoft Productivity Score provides companies insights on eight core areas of cloud app use in M365. This is divided into two areas:
- People Experiences (how your team is working within the platform)
- Technology Experiences (how your hardware, software, & network are functioning)
You can score up to 100 points in these 8 areas, for a total potential score of 800 (indicating team with top productivity):
- Meetings
- Mobility
- Communication
- Content Collaboration
- Teamwork
- Microsoft 365 Apps Health
- Endpoint Analytics
- Network Connectivity
In each area, you’ll find metrics on how your team is doing as compared to a variety of best practices. You can also compare your business with peers to see how you match up.
Note: Microsoft values privacy, so the metrics you see will be on your team as whole, not individual employees.
Here is an example of one of the insights, which is on the use of cloud document sharing as opposed to attaching files as emails. You can see how the tool gives you recommendations.
This particular metric and recommendation is based on a report by Forrester revealing that employees that share documents via the cloud instead of attaching files to emails can save 100 minutes per week (that’s over 85 hours per year).
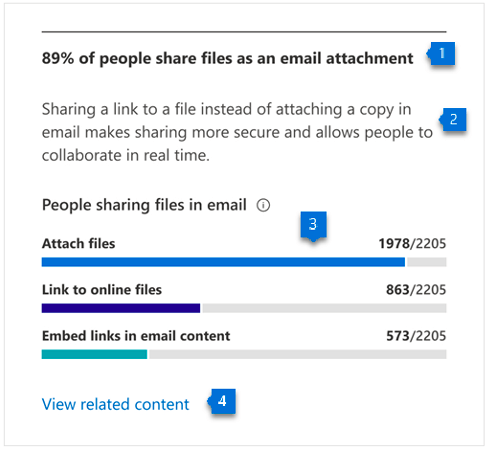
Image credit: Microsoft
Looking at the graphic above and the tagged numbers, here are the main elements you’ll find throughout the tool in multiple metrics.
- Header: Highlights the main metric being measured and an insight about your organisation.
- Body: Offers insight into best practices to improve productivity.
- Visualisation: A graph or chart providing you with a valuable data visualisation.
- Link to resources: A link to find more resources on this metric.
Productivity Score Metrics You’ll See
Meetings
The primary metric you’ll find in the Meetings section is how many of your team are conducting online meetings using best practices. Best practices include things like use of screensharing, sharing files to help people better take in the information, and using video for face-to-face interactions.
You can also see how many of your team members spend over 20 hours a week in meetings.
Mobility
This area gives you visibility into how many of your employees are fully benefitting from mobility. For example, how many are reading email on more than one device.
Communication
Communication is vital to well-performing teams, and this is especially so if they’re working remotely. One of the key metrics in this section is how many people are communicating using more than one method (e.g. chat, email, etc.)
Content Collaboration
Is your team accessing and sharing content productively? The primary insight you’ll find under collaboration is your number of collaborating employees. This includes how many of your team are using your online resources as:
- Readers
- Creators
- Collaborators
Teamwork
The Teamwork metric looks at how many on your team are actively participating in shared workspaces, such as Microsoft Teams. You can see a breakdown of how many employees are collaborating with their team by sending email, posting messages, and creating team content.
Microsoft 365 Apps Health
This metric is related to the health and security of the Microsoft apps your team is using. You’ll see metrics, such as how many devices have apps that are updated to the current version.
Endpoint Analytics
If you use Microsoft Intune with your Microsoft 365 subscription, then you can get important insights here about endpoint hardware and software health and any recommendations for improvement.
Network Connectivity
This metric gives you details on how your network is performing and if it’s causing lower productivity due to connection problems.
Learn How to Fully Optimise Your Use of the Cloud!
Connected Platforms can help your Brisbane area business optimise your cloud use through custom automations, settings, team training, and more.
Contact us for a free consultation. Call (07) 3062 6932 or book a coffee meeting online.